Observability
What Observability shows
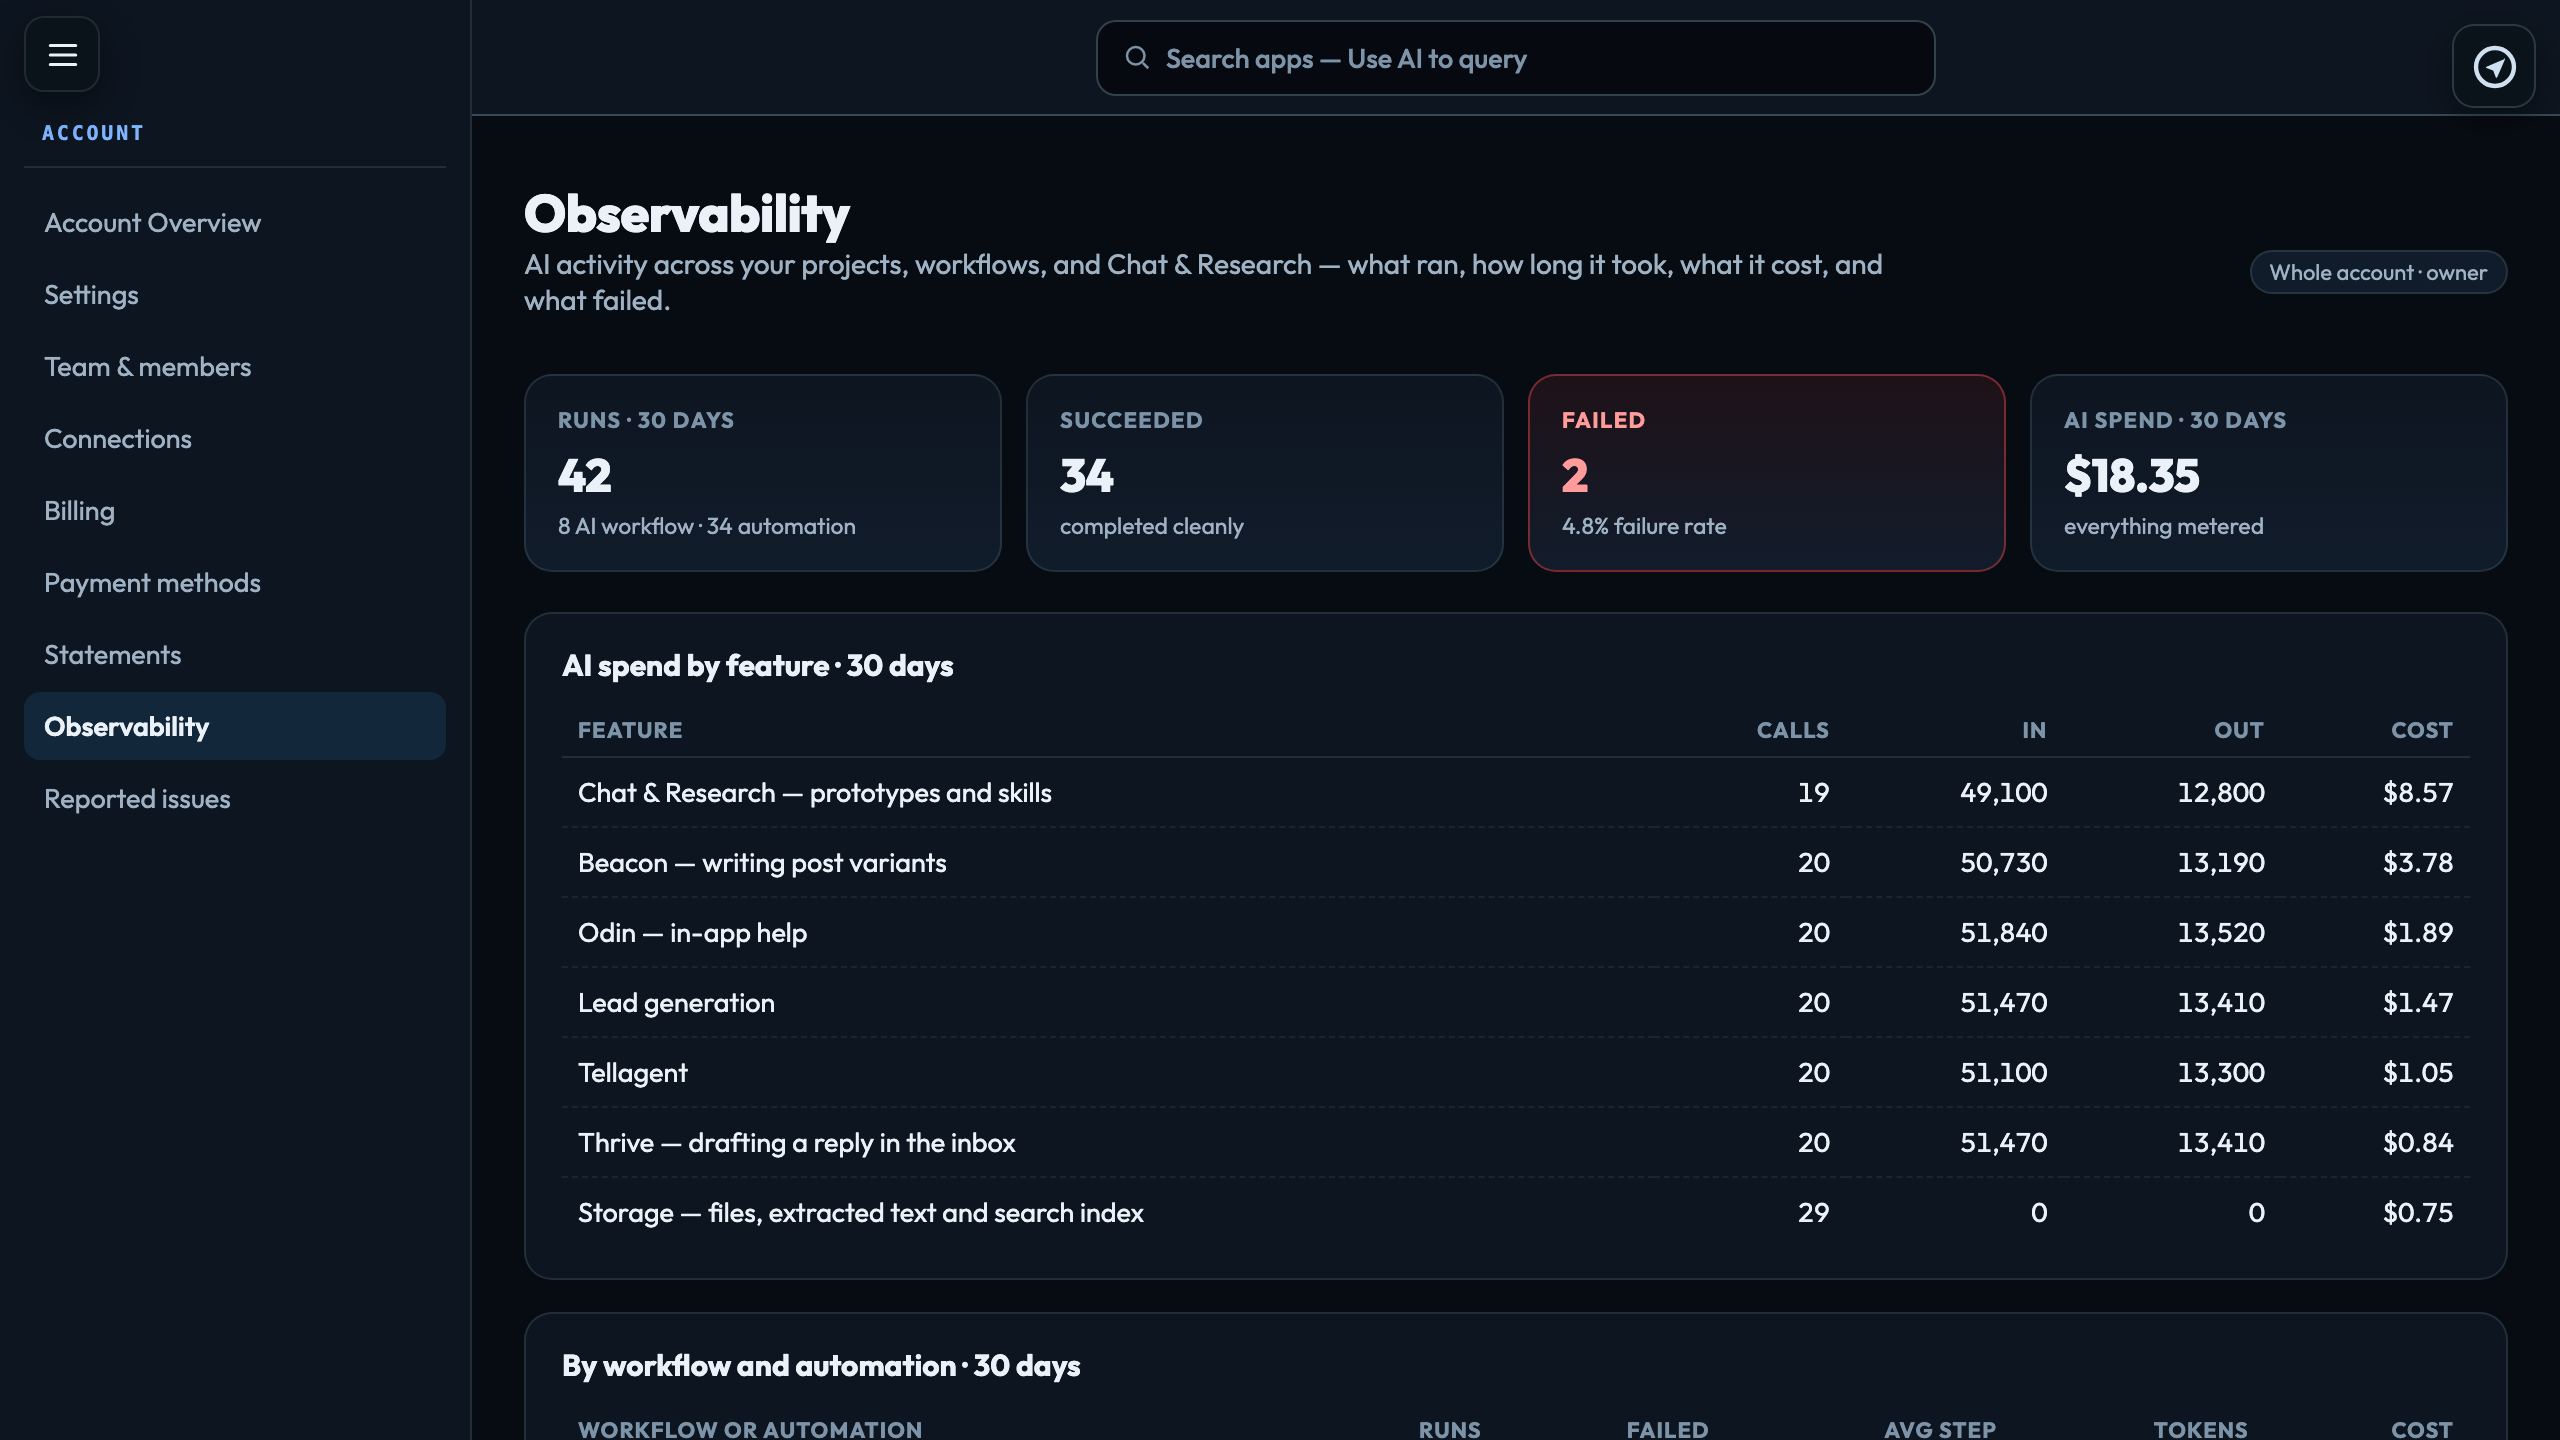
Account → Observability shows what your AI did across every project in the account over the last 30 days: what ran, what it cost, and what failed.
The page
| Runs · 30 days | How many runs there were: AI workflow runs and automation runs together, with how many of each under the number. These are the runs Run history lists, across every project. |
|---|---|
| Succeeded | How many finished cleanly (an automation run that reached its end). |
| Failed | How many failed, AI workflows and automations together, counting workflow runs that Partly failed (stopped at a time, step or spend limit before every step ran), with the failure rate. It turns red when anything has failed. |
| AI spend · 30 days | Everything metered in that time, across every app. |
Below the tiles:
| AI spend by feature · 30 days | Each app and feature that used credit, with its calls, tokens in and out, and cost, largest first. |
|---|---|
| By workflow and automation · 30 days | Each AI workflow's and automation's runs, failures, average step time, tokens and cost, with AI workflow or Automation under its name. |
| Recent runs | The 25 most recent AI workflow and automation runs, newest first, each marked AI workflow or Automation: status, what started it, steps, duration, tokens, cost and when. |
Whose activity
The label at the top right says what you are looking at. Whole account is what owners and admins see: everyone's activity. Anyone else sees the workflows and automations they own and their own usage, labelled Your workflows and automations only.
Check it when spend jumps or when a workflow stops producing what you expect. Reading the cost numbers